Basic Use
A tour of the pages and tables available to PIs and Fiscal Officers in Walter
Rob Martinsen
Apr 17, 2026
Overview
Walter is the Warehouse Analytics and Ledger Tools for Enterprise Reporting. This guide walks Principal Investigators (PIs) and Fiscal Officers through the pages and tables they will use most often. Most pages are the same for both roles, though some may differ between Fiscal Officers and PIs.
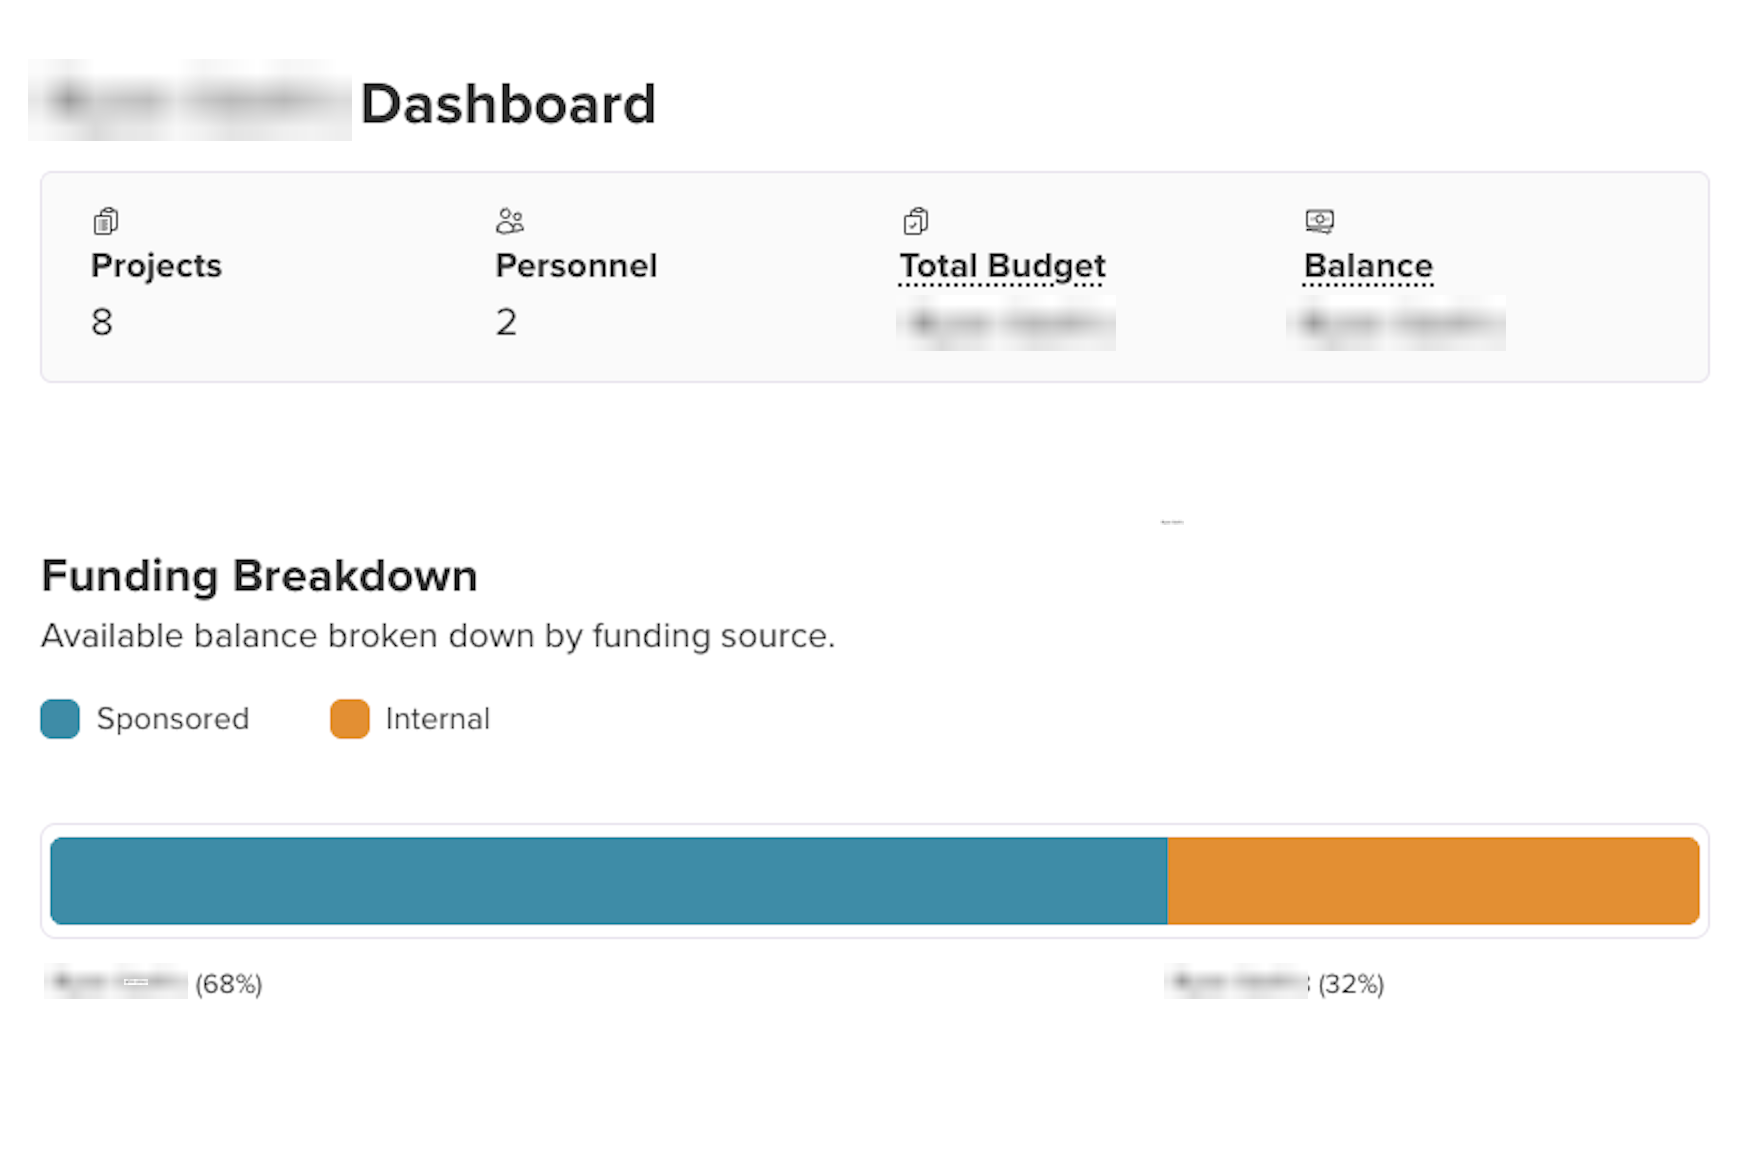
All Projects Summary
The All Projects Summary is your main overview in Walter. For PIs, it shows your projects. For Fiscal Officers, it shows projects for the PI selected from the landing page. At a glance, it shows how many projects and personnel are associated, the combined Total Budget, and the remaining Balance. Below the summary cards, the Funding Breakdown chart splits the available balance between Sponsored and Internal funding sources.
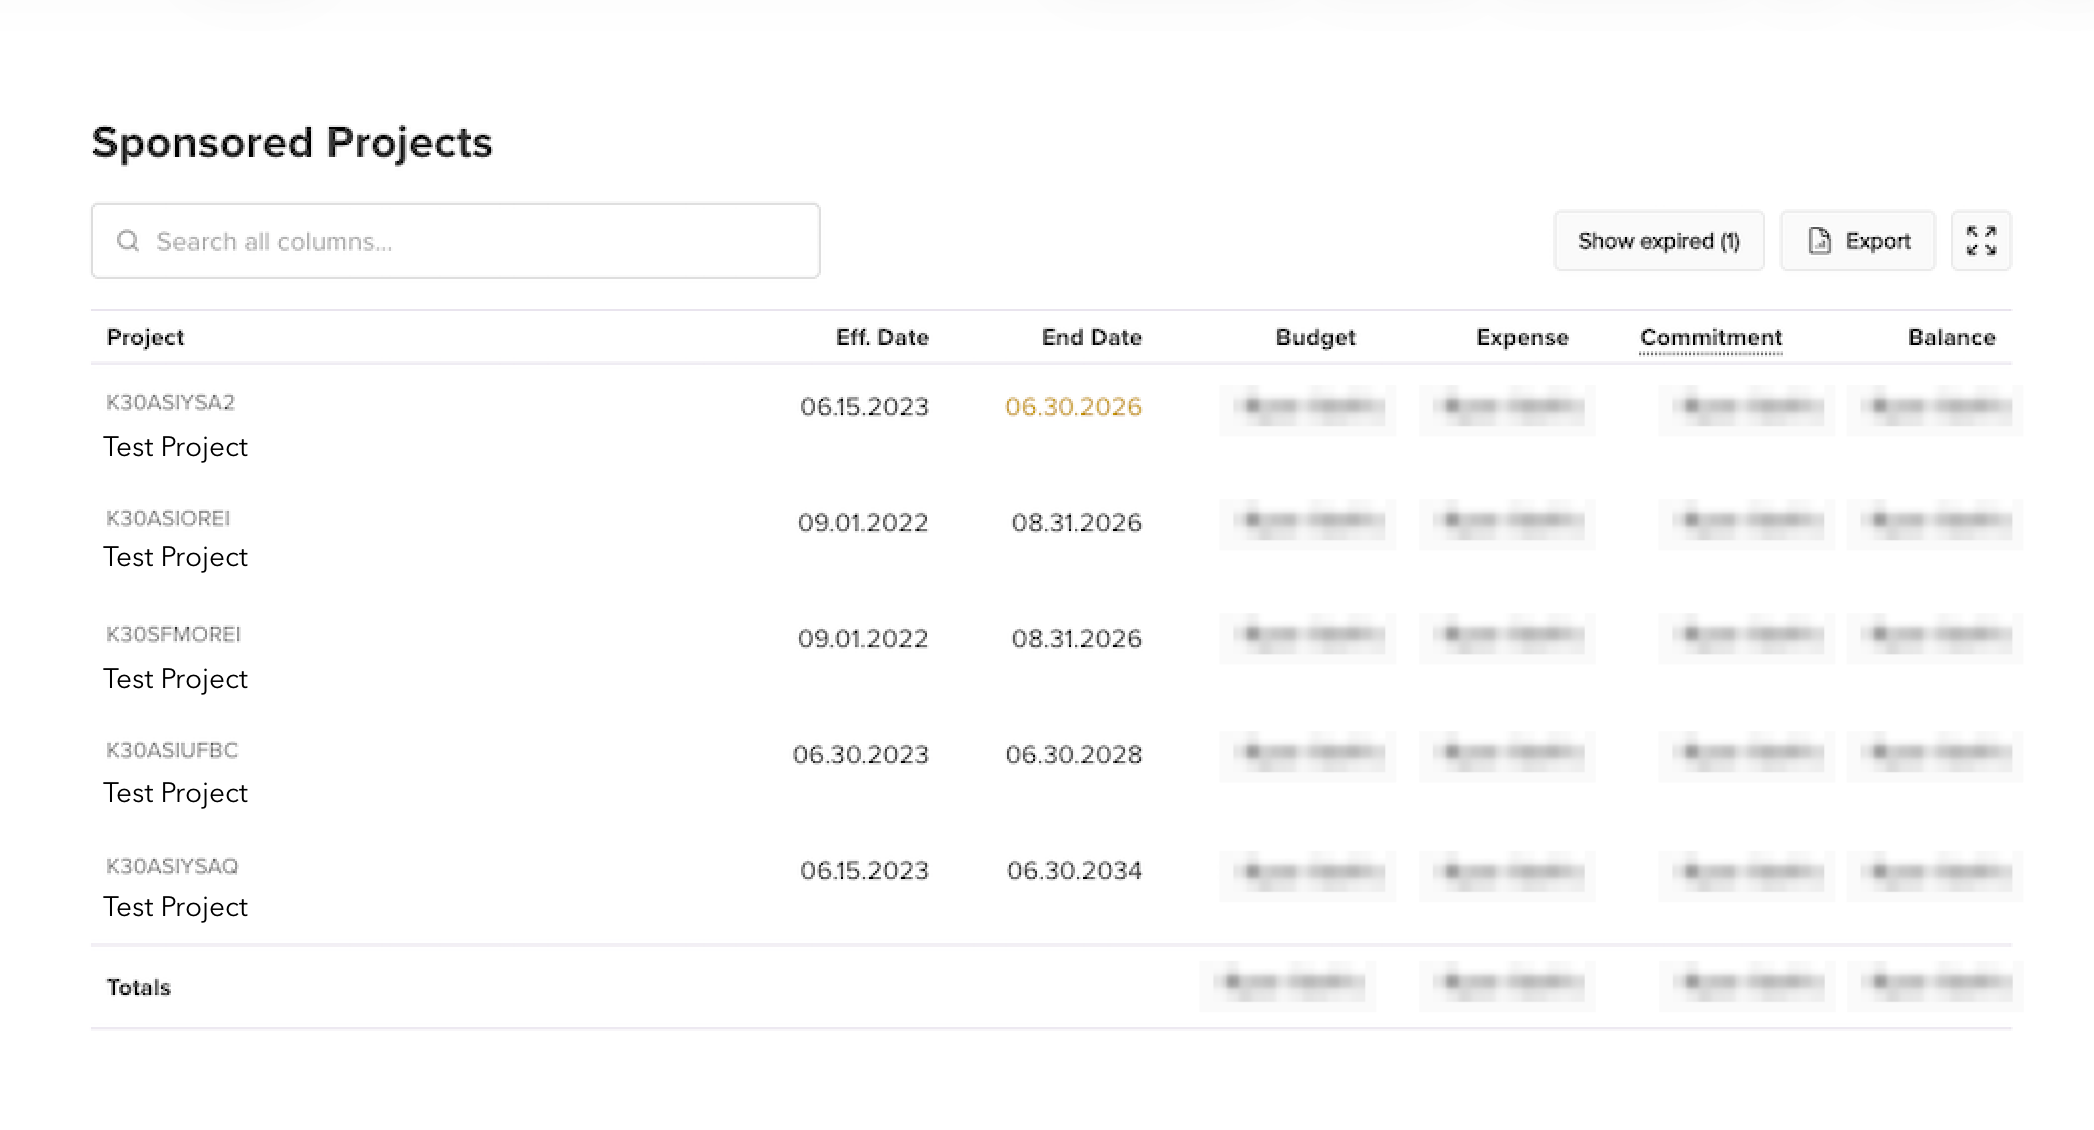
Sponsored Projects Table
The Sponsored Projects table lists all active sponsored projects, with columns for the project code and name, effective and end dates, Budget, Expense, Commitment, and Balance. A Totals row at the bottom sums the financial columns.
Use the search box to filter across all columns. Click Show expired to include projects whose end dates have passed. End dates highlighted in orange indicate projects expiring within 90 days, and balances shown in red indicate overdrawn projects. The Export button downloads the current view as a CSV, and the expand icon opens the table in a full-screen view.
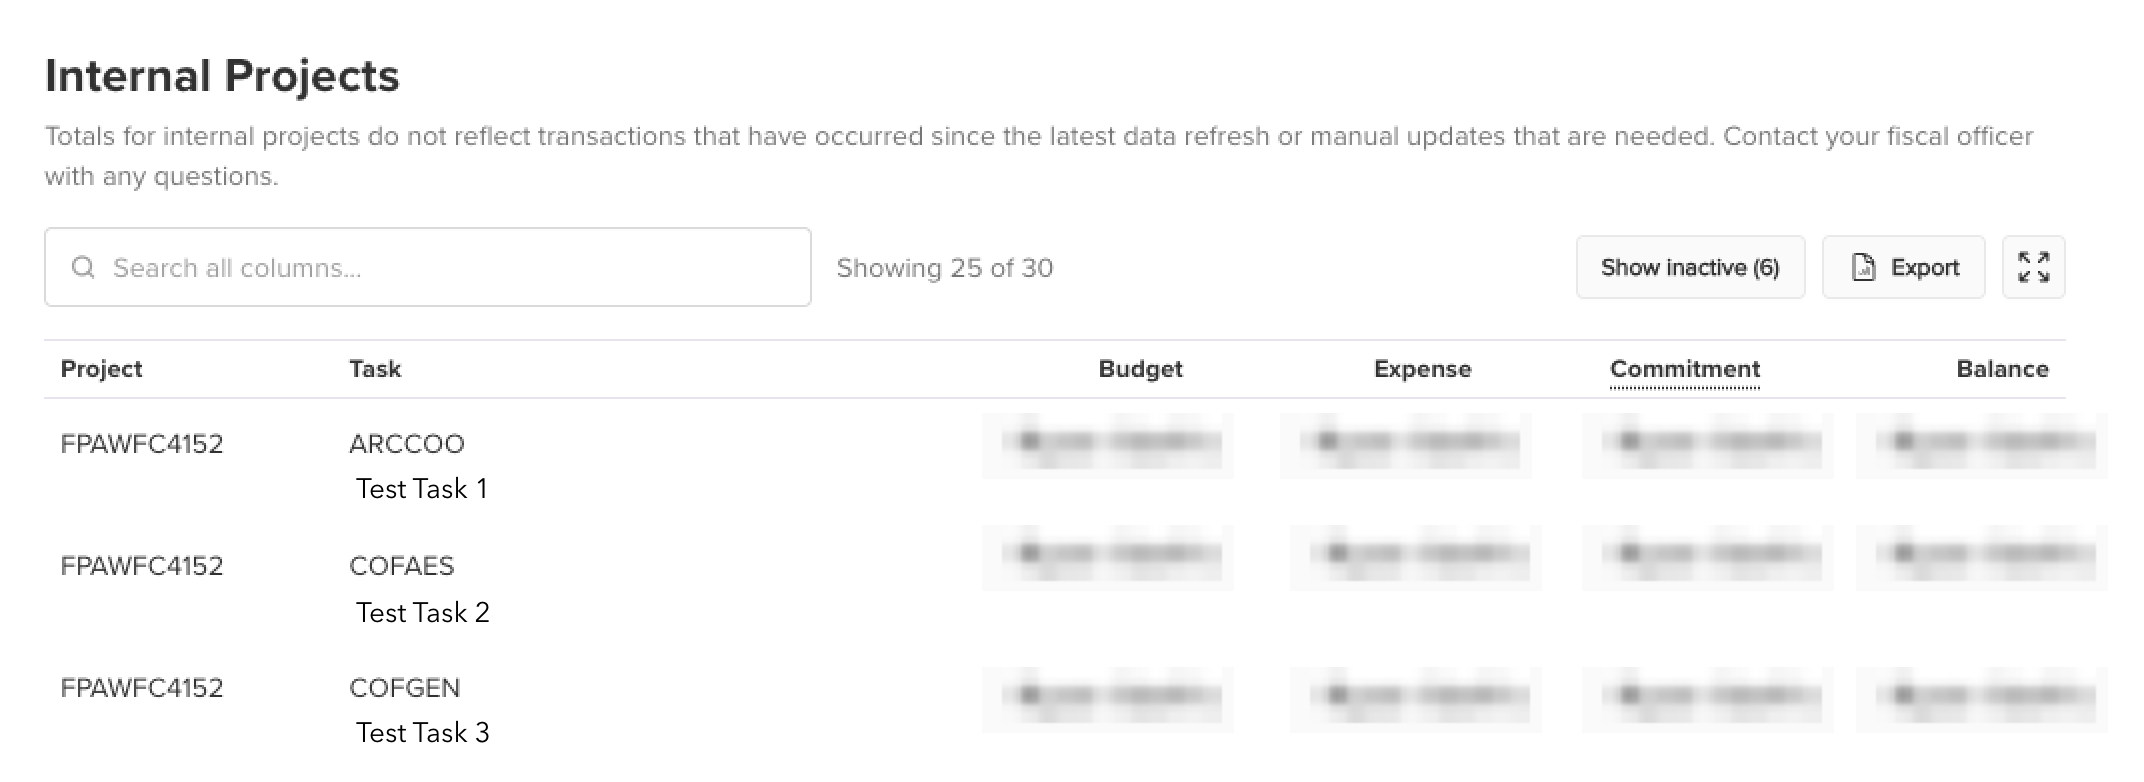
Internal Projects Table
The Internal Projects table lists non-sponsored projects, broken down by task. Each row represents a task within a project, with columns for Budget, Expense, Commitment, and Balance.
Totals in this table may not reflect transactions since the latest data refresh or any manual updates that are pending.
Use the search box to filter across all columns. Click Show inactive to include inactive tasks. Balances shown in red indicate overdrawn tasks. The Export button downloads the current view as a CSV, and the expand icon opens the table in a full-screen view.
Personnel Table
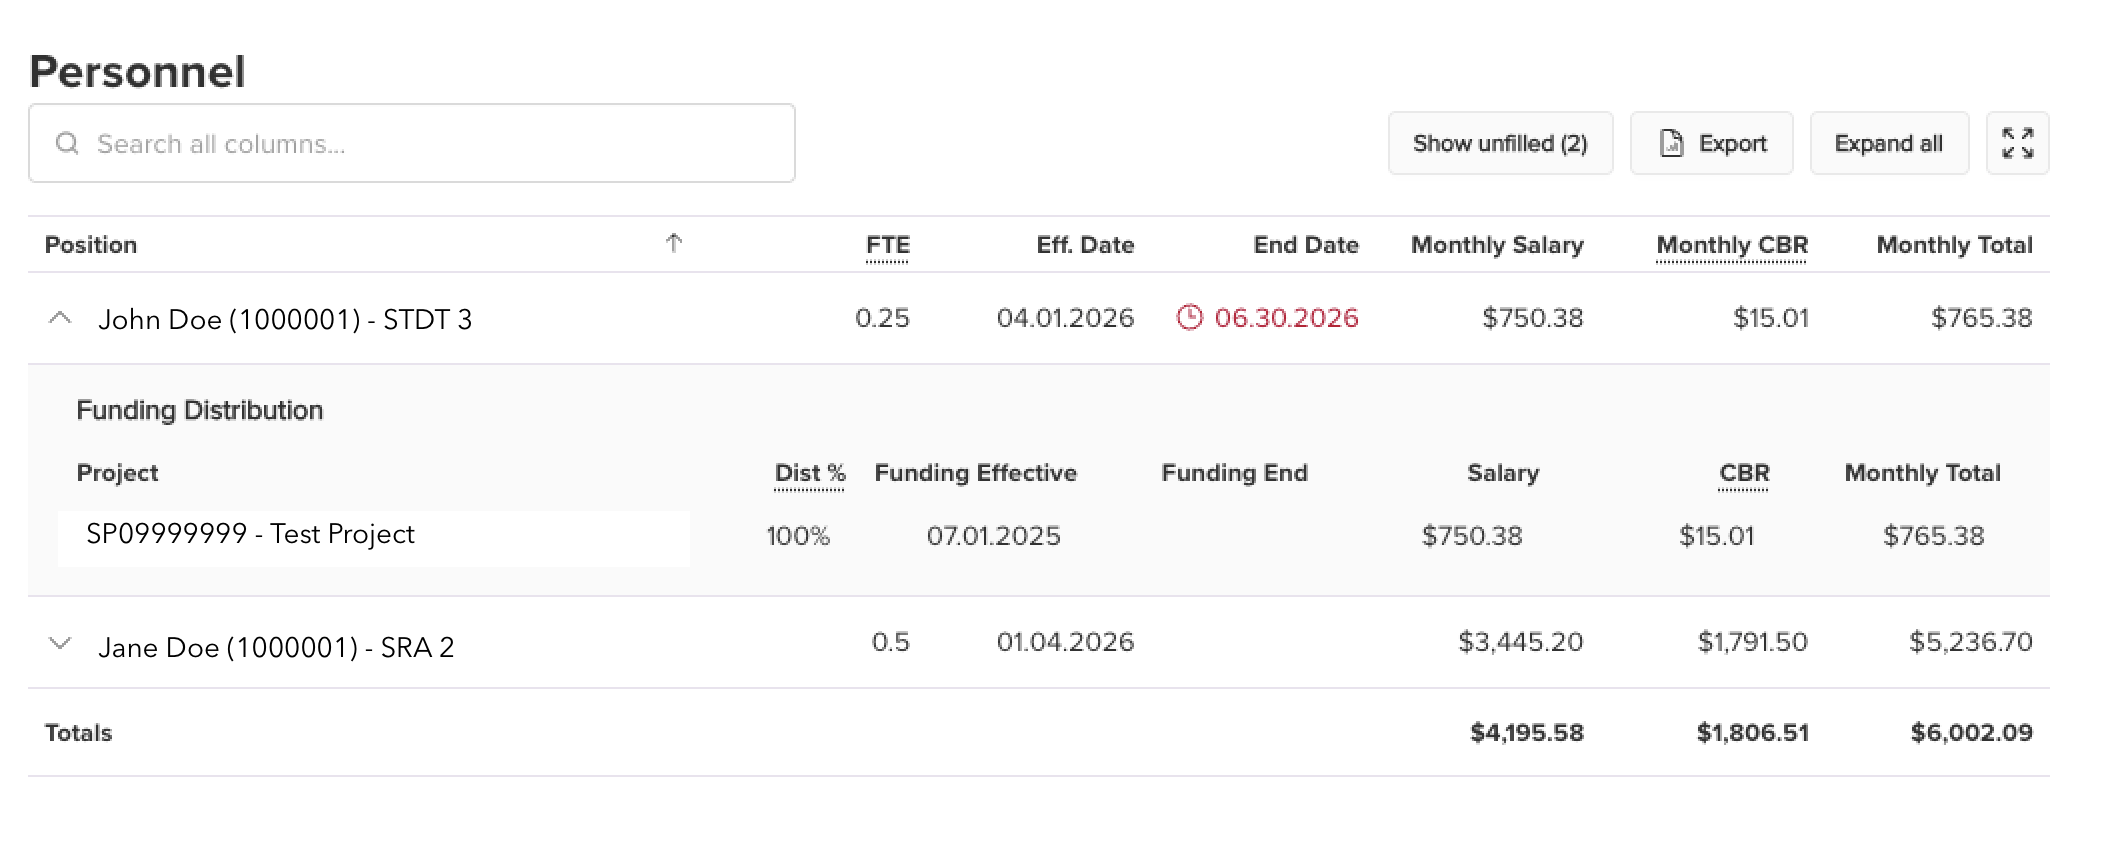
The Personnel table lists everyone with a funding distribution on your projects. The first column identifies each person by name, employee ID, and job title. Remaining columns show FTE, effective and end dates, Monthly Salary, Monthly CBR, and Monthly Total. CBR (Composite Benefit Rate) is calculated based on the employee's job code. A Totals row at the bottom sums the financial columns.
End dates highlighted in red with a clock icon indicate positions ending within 90 days. Click the arrow next to any row to expand it and see the employee's Funding Distribution — which projects their salary is charged to, the distribution percentage, funding effective and end dates, and the per-project salary, CBR, and Monthly Total.
Use the search box to filter across all columns. Expand all opens every row's funding distribution at once. The Export button downloads the current view as a CSV, and the expand icon opens the table in a full-screen view.
Project Detail
Click any project in the left nav to view the details for that project.
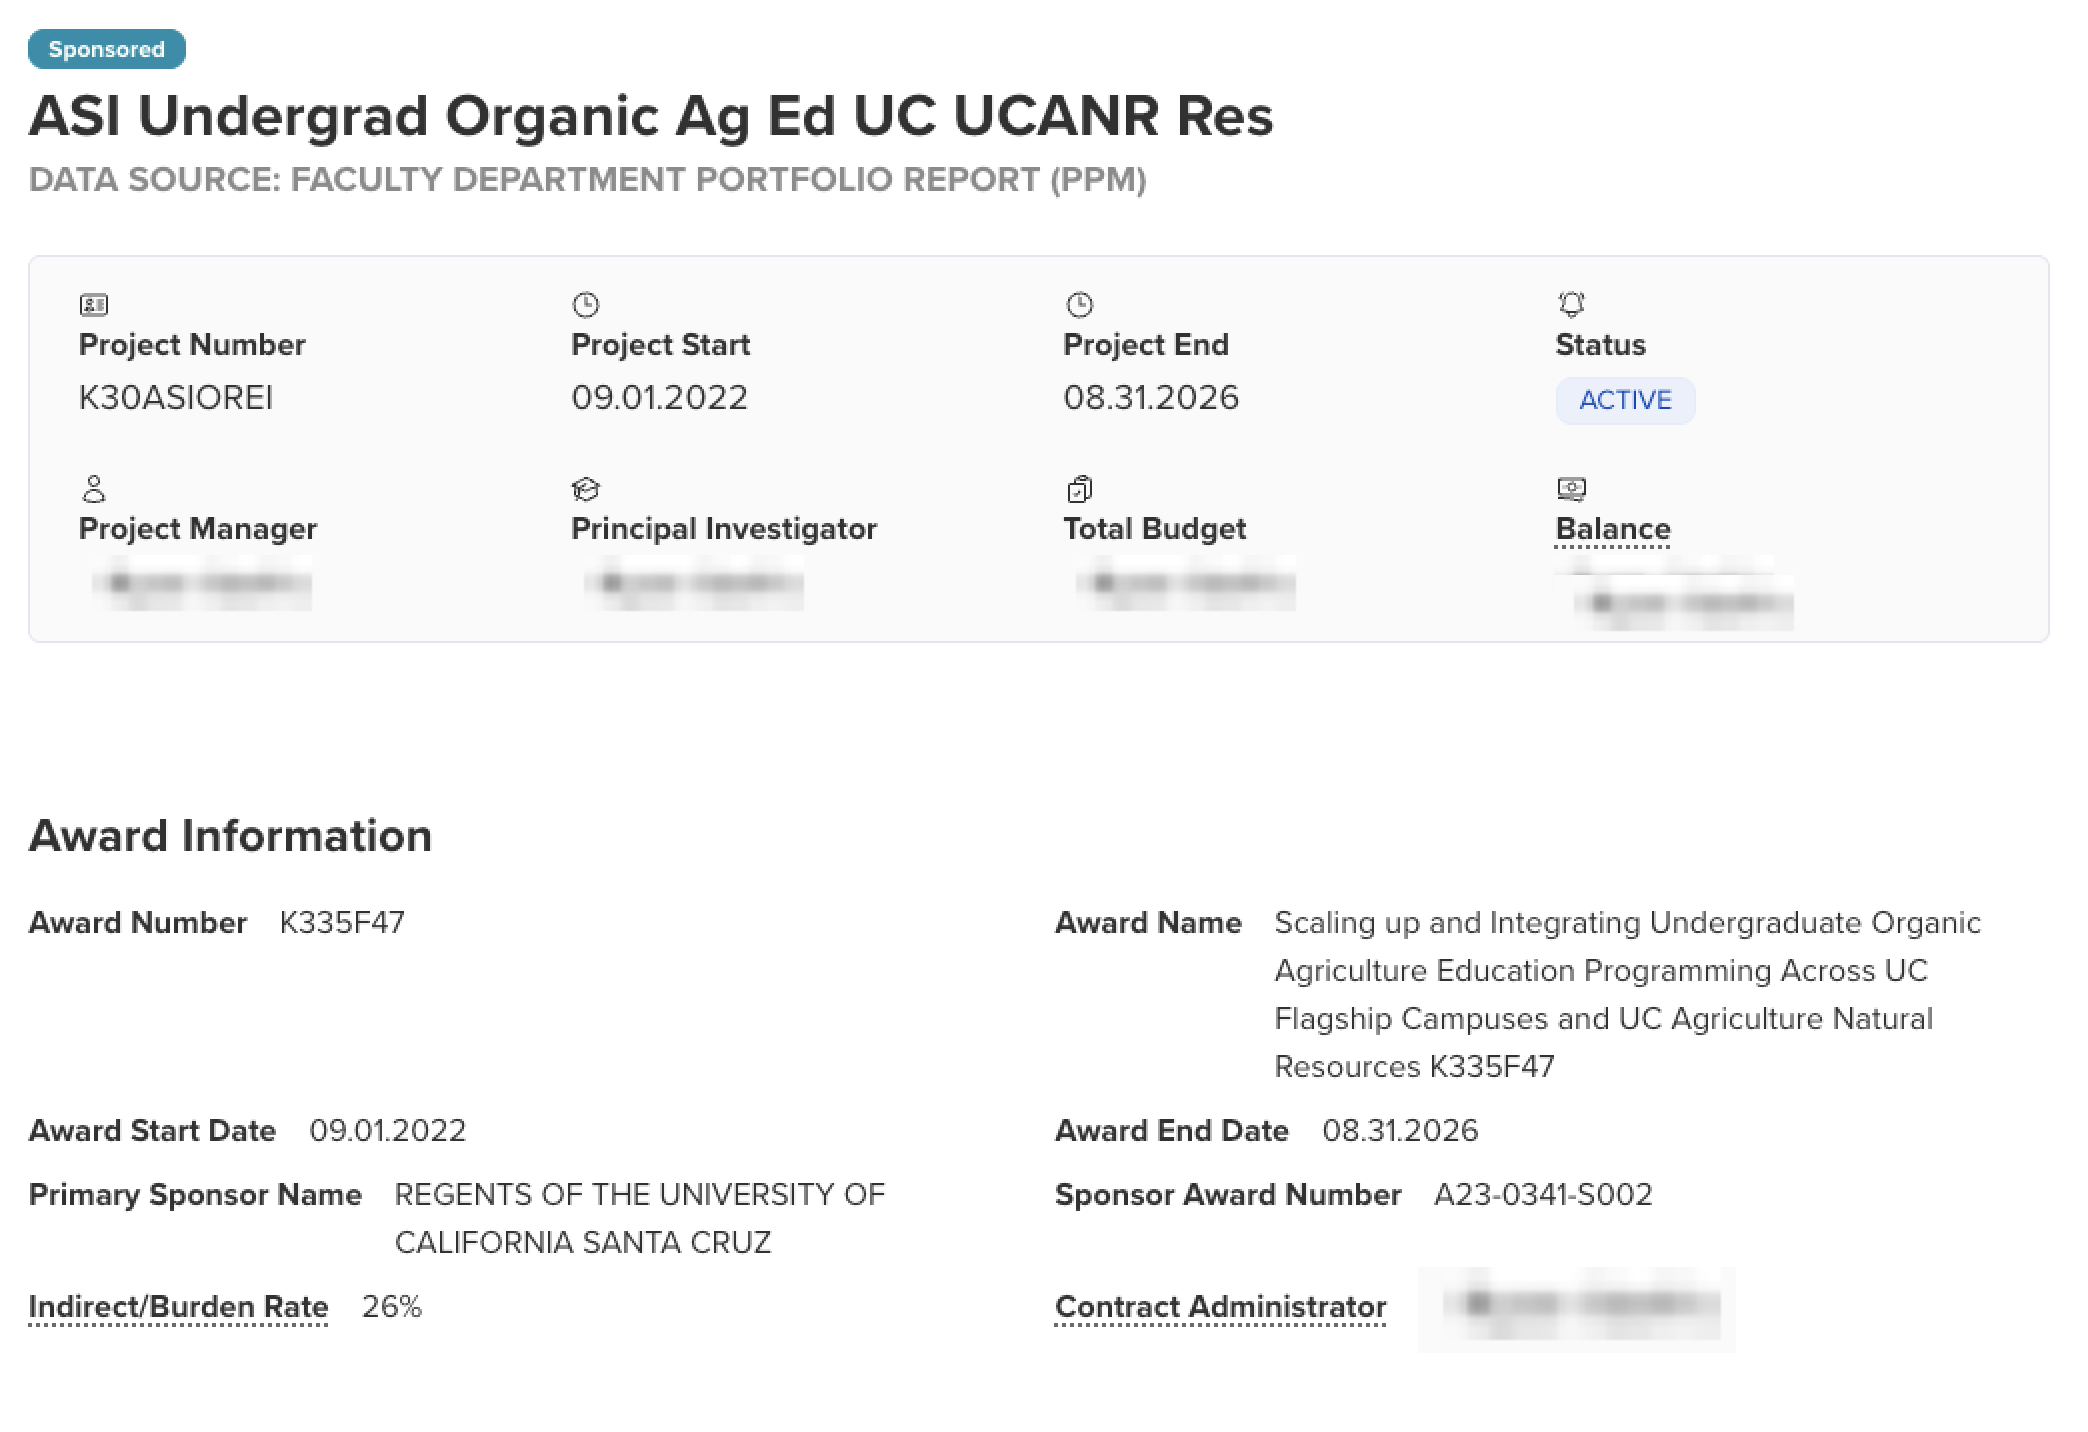
The summary at the top displays the project name and type (Sponsored or Internal), project number, start and end dates, status, relevant people, Total Budget, and Balance.
For sponsored projects, an Award Information section appears below the summary with the award number and name, award start and end dates, primary sponsor name, sponsor award number, indirect/burden rate, and contract administrator.
The Project Detail page also includes Financial Details, a breakdown by task, and any personnel funded on the project. Budget data comes from the Faculty and Department Portfolio Report (PPM).
Task Expenses by Category
Click the Details link on any task in the Task Breakdown to see expenditures by category.
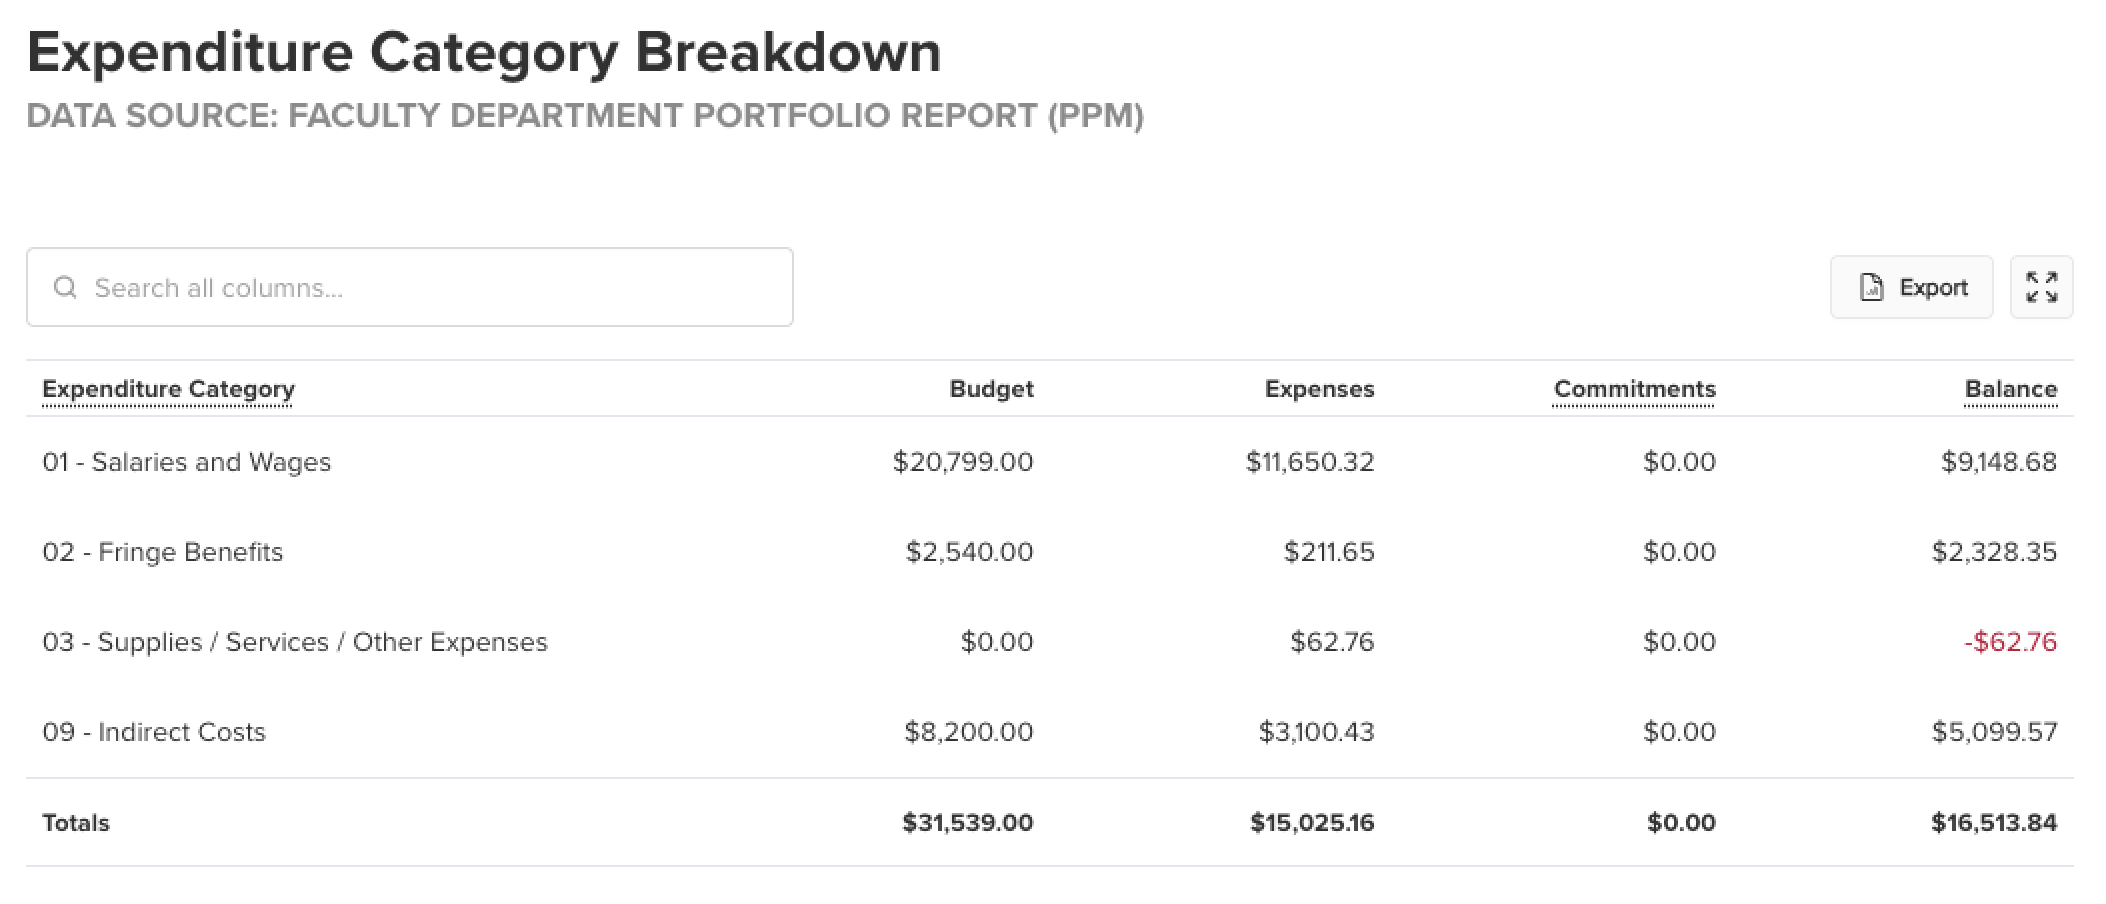
The Expenditure Category Breakdown groups expenses for the selected task by category — Salaries and Wages, Fringe Benefits, Supplies / Services / Other Expenses, and Indirect Costs — with columns for Budget, Expenses, Commitments, and Balance. Negative balances appear in red. A Totals row at the bottom sums each column.
Use the search box to filter across all columns. The Export button downloads the current view as a CSV, and the expand icon opens the table in a full-screen view.
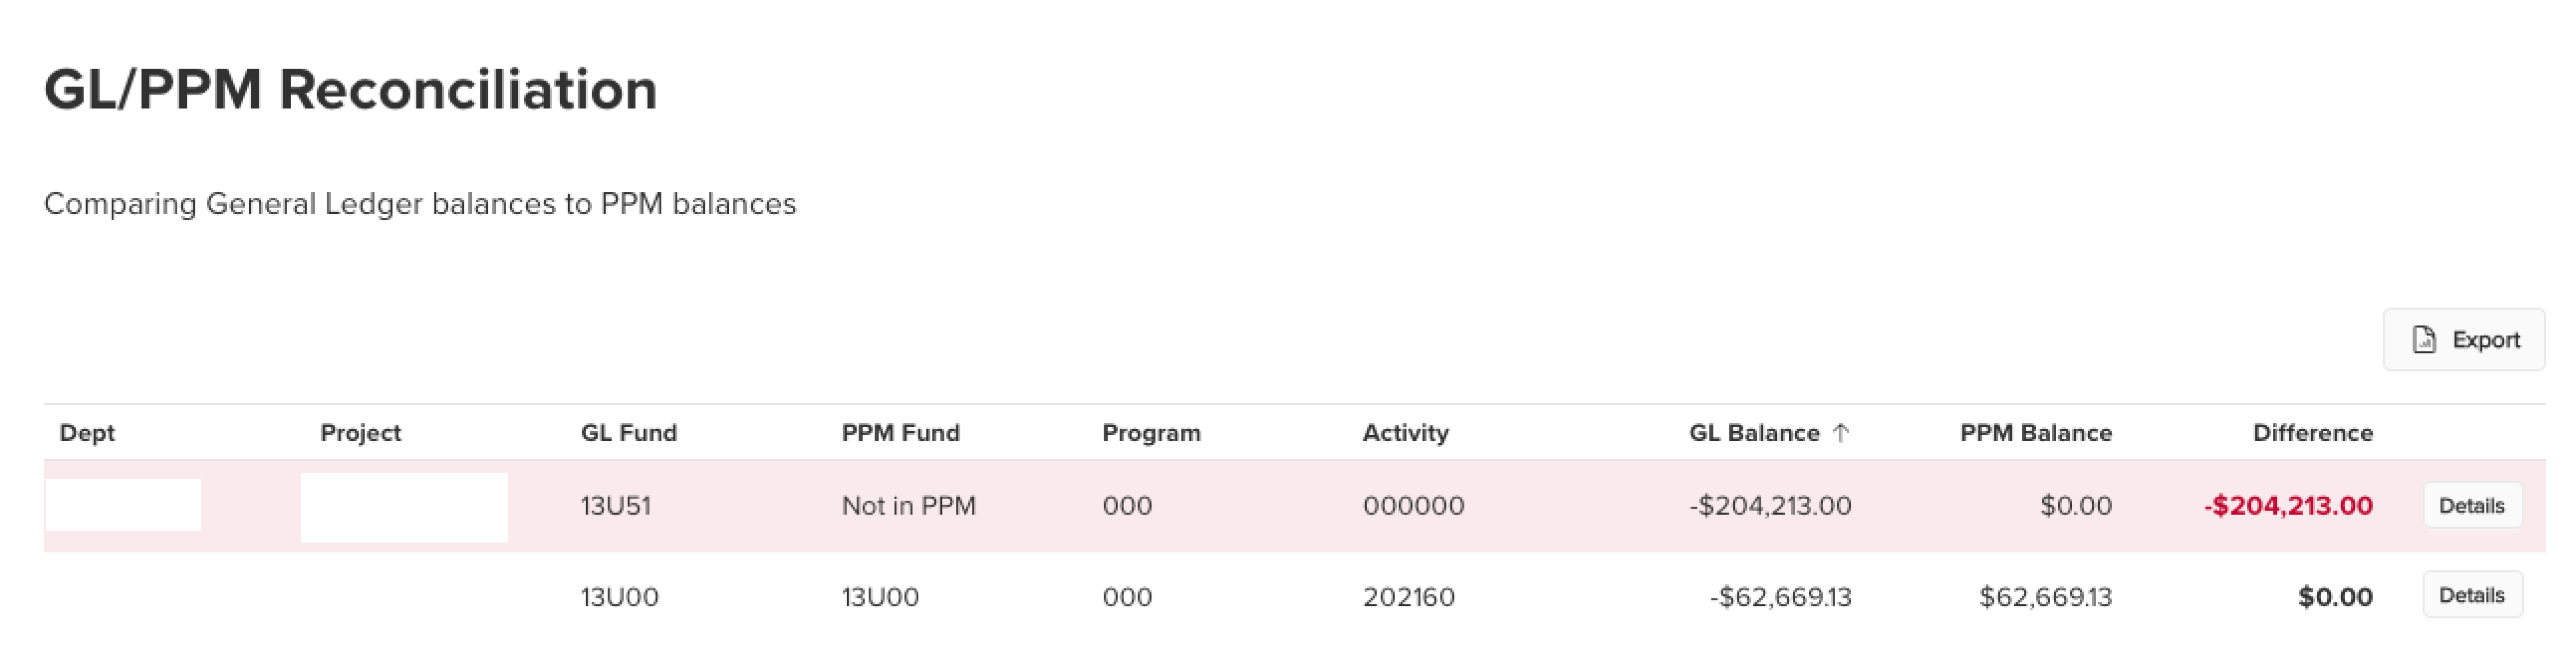
GL/PPM Reconciliation
Note: GL/PPM Reconciliation is only available to Fiscal Officers. PIs do not have access to this page.
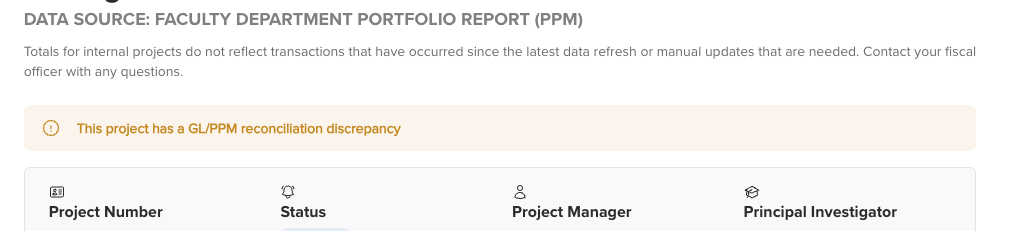
If a project has a GL/PPM discrepancy, a warning banner appears on the Project Detail page. Click the warning to jump to the reconciliation report.
The report compares General Ledger balances to PPM balances and highlights any discrepancies; rows with a non-zero Difference are shaded. Click Details on any row to drill in and see the relevant PPM tasks and GL transaction listings.